| A | B | C | D | E | F | |
|---|---|---|---|---|---|---|
1 | Pertanyaan | PIC | Jawaban | Dokumen Pendukung | ||
2 | A. Head Quarter | |||||
3 | 1. Company Wide Strategy | |||||
4 | a. What are the Company’s key strategic priorities over the next 1–2 years, and what specific initiatives are currently being implemented to achieve them? | bu Elaa, Inka, Sony | SMM, our proven revenue generator, will be the primary focus for performance optimization. This will be achieved by expanding branches into thoroughly researched locations, maximizing student capacity at each branch, and enhancing operational efficiency & service quality. Additionally, the integration of our core learning, payment, and admission platforms will be completed within the next academic year. This will ensure superior data synergy, streamlining cross-selling and upselling opportunities between business unit through personalized user reports. | |||
5 | b. What are the Company’s medium-term strategic priorities over the next 2–5 years? | bu Elaa, Inka, Sony | 1. Enterprise Growth via KTM Scale Operations: Aggressively grow KTM to capture a significantly larger market share. Secure High-Value Corporate Contracts: Focus heavily on B2B acquisition by securing long-term agreements with major corporations boasting large-scale workforces (thousands of employees per organization) to build a stable, predictable revenue stream. 2. SMM Goes International Global Footprint: Transition SMM from a domestic leader into an international brand, strengthening SMM Brand for Indonesian market. Strategic Market Entry: Execute an expansion roadmap specifically targeting the Malaysian market as the primary launchpad for regional growth. 3. Synergistic Scaling for Sekolahmu & Living English Knowledge Transfer: Replicate the successful operational playbooks, marketing strategies, and key learnings developed during SMM's proven growth phase. Boost Enrollment: Apply these insights to drive aggressive student acquisition and scale up enrollment figures for both Sekolahmu and Living English. | |||
6 | c. What is the Company’s long-term strategic vision beyond 5 years, and what key milestones must be achieved for the Company to realise this ambition? | bu Elaa, Inka, Sony | Beyond 5 years, the Company’s long-term strategic vision is to democratize and elevate the quality of education across Indonesia by providing comprehensive learning and developmental interventions. This ecosystem will support individuals at every stage of their lifecycle, from students across all educational levels to professional talent within corporations and organizations nationwide. To realize this ambition, the key milestones will include expanding our educational frameworks to seamlessly cover all K-12 and higher education segments, establishing a ubiquitous corporate training network across Indonesia's major industries, and building a fully unified data infrastructure capable of delivering personalized, high-impact learning outcomes at a national scale. | |||
7 | 2. Risks | |||||
8 | a. What does management consider the top 10 risks to achieving the business plan? | Head BUs, Nurul | ||||
9 | b. What mitigation plan exists for each risk? | Head BUs, Nurul | ||||
10 | c. What are the early warning indicators that the plan is underperforming? | Head BUs, Nurul | ||||
11 | d. What downside case has management prepared? | Head BUs, Nurul | ||||
12 | 3. IT Infrastructure and Data Systems | |||||
13 | a. What systems does SID use for student enrolment, CRM, billing, scheduling, attendance, teacher management, and financial reporting? | Inka, Head BUs, Ican, Andreas | 1. Financial Reporting is using SAP business one but we are about to launch new ERP system with more advance and complete features. 2. All learning management system (incl. attendance) using our in-house platform 3. Billing system using our in-house platform (collab with payment gateway) 4. CRM system using barantum & zoho but soon will move to our in-house platform 5. HRIS using Haermes | |||
14 | b. Are lead generation, conversion, retention, churn, CAC, and occupancy tracked systematically or manually? | Head BUs, Yulia | systematically | |||
15 | c. Is there a centralised dashboard by segment, hub, city, and program? | Inka, Head BUs | yes | |||
16 | d. How reliable is historical operating data, and since when has it been consistently tracked? | Head BUs, Andreas | 1. Financial data has been reliably maintained at the company level since 2019, with audited financial statements available from 2019 onward. It is Audited by Independent Audit Firm. However, financial data tracked by business unit has only been consistently available from 2023 onward. | |||
17 | e. What IT investments are required to support the forecast growth? | Inka, Head BUs | We expect to clear our remaining development backlogs by the next academic year. After 2027, our tech requirements will shift strictly to ongoing maintenance | |||
18 | f. Are there cybersecurity, data privacy, or system downtime risks? | Rheza, Nurul | As a technology company serving more than 15 million users, SID recognizes cybersecurity, data privacy, and system availability as critical business risks. We mitigate these risks through an ISO/IEC 27001-certified Information Security Management System (ISMS), supported by security governance, continuous monitoring, vulnerability management, incident response procedures, and dedicated Engineering and Infrastructure teams. Our cloud infrastructure is designed with redundancy, backup, and disaster recovery capabilities to ensure business continuity. Over the past 12 months, our platforms have consistently exceeded their SLA targets and achieving 99.99% availability. Our platforms have not experienced any compromise resulting in customer data leakage or material business disruption. We continue to strengthen our security posture through ongoing monitoring, preventive controls, and continuous improvement. | |||
19 | g. Does SID own its platforms, or does it rely on third-party software? | Inka, Ican, Rheza | SID develops and uses its own platforms to support all business units and their clients, especially for assessment, learning, and consulting activities. These platforms also help manage important data such as payment, selection, and admission, so the process can run in a more connected and organized way. SID may still use third-party software for some supporting needs, but the main platforms are developed by SID. | https://roadmap.product-sid.us/semesta/ | ||
20 | 4. HQ Human Resource | |||||
21 | a. Please provide the current organisation structure by segment and function. | Jaim | Org. structure SID attached | Org. Structure SID | ||
22 | b. Which roles are centralised at group level and which are segment-level? | Jaim | SID runs a hybrid shared-services model: most enabling functions are centralised at the group level and serve all four BUs, while delivery, academic, admission, and sales capabilities sit inside each BU. Function role are centralised at group Level: Tech, Product, CEO Office & Corporate Finance, Finance & Procurement, Legal, People & Culture, Learning Space Development, Marketing & Communication and Customer Service For BU Role are segment-level: BU-SMM (Sekolah Murid Merdeka), BU-LE (Living English), BU-Sekolahmu and BU-KTM, Academic & Talent Science. | |||
23 | c. What are the key management positions currently vacant or under-resourced? | Jaim | Currently, all key management positions are filled. | |||
24 | d. What is the annual employee turnover rate by function? | Jaim | The annual turnover SID rate is 10,16%. Turnover rate by BU & Function attached | Turnover rate SID by BU & FU | ||
25 | e. Are compensation levels competitive versus similar education, training, and HR service providers? | Jaim | SID-level compensation is currently competitive with the market, particularly within the same industry. We consistently benchmark against the Indonesian market using salary surveys from Kelly Services, Michael Page and Robert Walters. | |||
26 | f. Does SID have incentive schemes tied to enrolment, retention, revenue, margin, or customer satisfaction? | Jaim | Yes, SID has an incentive scheme. Incentive scheme SID to the organization's target, such as revenue, new leads, and retention | |||
27 | ||||||
28 | ||||||
29 | B. SMM | |||||
30 | 1. Student Growth Assumption. In the management model, SMM student enrolment is projected to increase year-on-year | |||||
31 | a. How does the management think of the acquisition strategy? What are the key 3-5 strategies in student acquisition? E.g. acquisition by channel, by education level, by target segment, etc. | Yason, Yulia | Primary Target: "Exploring Idealists" (Early Adopters | ~10% of Indonesian households) SMM's primary acquisition focus is on Exploring Idealists—progressive parents whose educational values are already closely aligned with SMM's philosophy. As early adopters, they require less persuasion about why alternative education matters and are more willing to embrace a new schooling model. Potential families are identified through behavioral indicators rather than demographics alone, such as: - Residence in newly developed housing estates or premium clusters - Progressive lifestyle and parenting behaviors outside education - Active participation in non-traditional educational activities beyond formal schooling For this segment, most leads already come organically and the strategy is to deliver an exceptional end-to-end experience—from the first interaction, consultation, and trial class through enrolment and the ongoing school journey. The objective extends beyond student acquisition to creating highly satisfied parent advocates who generate strong word-of-mouth and referrals, establishing credibility within their communities. Secondary Target: "Social Go-Getters" (Early Mainstream | ~40% of Indonesian households) As SMM scales, growth will increasingly come from Social Go-Getters—parents who remain open to innovation but seek external validation before making educational decisions. Compared to early adopters, this segment requires greater trust-building and proof that SMM is a credible and successful alternative. The acquisition strategy focuses on gradually expanding awareness and consideration through a combination of: - Above-the-line (ATL) initiatives to build brand awareness and category education, including curated KOL collaborations (e.g. as guest teachers), social media content, and digital awareness campaigns. - Below-the-line (BTL) local activations, such as open houses, community and public space events, allowing parents to directly experience SMM's learning approach and understand how it differs from conventional schools. The objective is to progressively move this larger mainstream audience from awareness to consideration, while leveraging advocacy from early adopters to provide the social proof needed to accelerate adoption. | |||
32 | b. What are the key drivers behind the projected increase in student enrolment: higher leads, higher conversion, higher retention? | Yason, Yulia | The projected increase in student enrolment is driven by three primary levers: 1. Higher Lead Generation: Management has maintained a conservative assumption by holding the overall lead-to-enrolment conversion rate at 9.5% over the near term, in line with current best-practice performance. As a result, enrolment growth is primarily supported by generating a proportionately higher volume of qualified leads. 2. Improved Conversion Efficiency: While short-term projections assume a stable conversion rate, over the longer term, management expects conversion rates to improve gradually from 9.5% to 12% through stronger brand equity, more targeted customer acquisition, enhanced consultation quality, and a more standardized sales process across hubs. 3. Higher Student Retention: In addition to acquiring new students, management expects retention to improve across both key dimensions: a. Within-level retention (students progressing within the same education stage—PAUD, SD, SMP, and SMA) is expected to increase b. Cross-level retention (students continuing from one education stage to the next, e.g., PAUD to SD or SD to SMP) is expected to improve increasing student lifetime value and reducing reliance on new student acquisition. | |||
33 | c. Does the company has historical lead generation, conversion rate, and enrolment data by hub for the past 3 years (Current data is aggregate and only for FY25). Please explain the acquisition from last academic year | Yason, Yulia | 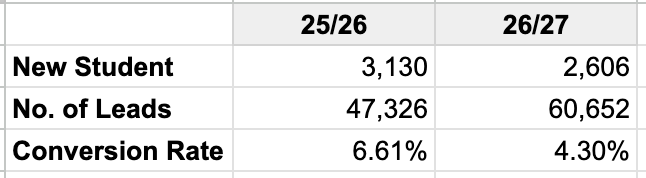 | |||
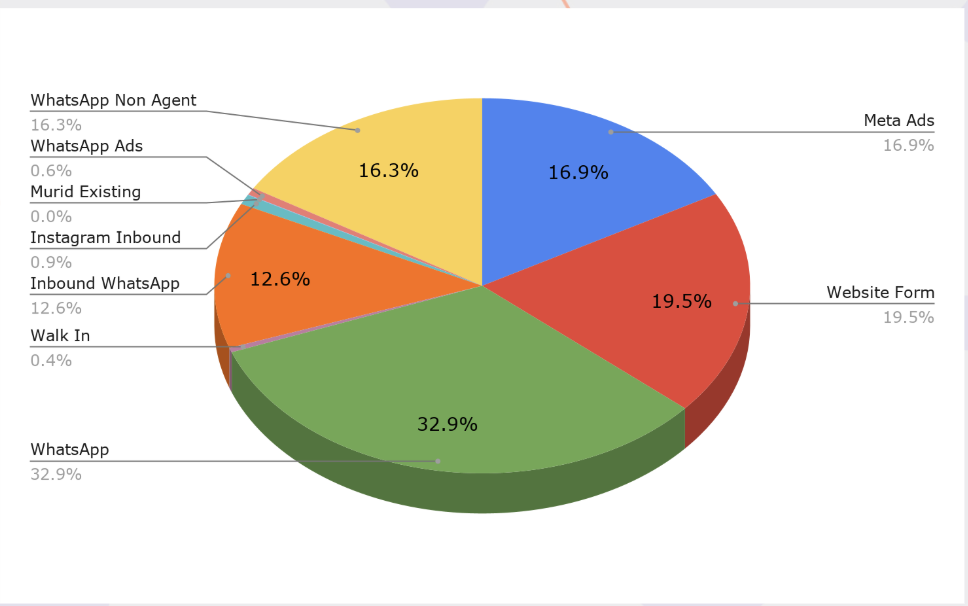
34 | c.i. How many available seats were available across the country? How many leads were generated? What is conversion from leads to enrolled students | Yason, Yulia | There are 14,000 seats. With 4,986 seats occupied, the available seats are 9,014. Conversion from leads to enrolled students are around 6% | |||
35 | c.ii. What are the key acquisition channels? What is the contribution proportion for each channel for enrolled student? Which channel has the highest leads highest conversion rate? Why? | Yason, Yulia | Top Lead Source Whatsapp: 49.2% Website Form: 19.5% Meta Ads: 17.5% Instagram DM: 12.6% SMM's lead acquisition is predominantly organic (82.6%), demonstrating strong brand awareness and parent trust, with WhatsApp (49.2%) and Website Forms (19.5%) serving as the primary entry points. Paid channels contribute 17.5%, driven almost entirely by Meta Ads, indicating that advertising effectively expands reach but is not the main driver of lead volume. | |||
36 | c.iii. How is the student acquisition different in 1st tier vs 2nd tier cities; in Java and outside Java; new locations vs established locations? | Yason, Yulia | - Established Tier 1 markets (particularly Jadetabek): consistently achieve higher lead-to-enrolment conversion, reflecting greater market readiness, stronger awareness of alternative education, and higher trust in progressive school models. - Tier 2 cities and markets outside Java: typically generate strong awareness and lead volumes - demonstrating strong interest in SMM value - but lower lead-to-enrolment conversion, indicating that demand exists but market adoption is still at an earlier stage. This suggests parents require more time and education before making enrolment decisions. They might even need adjusted program and school facility more similar to those of conventional schools to speed up the adoption process. - Accordingly, acquisition strategies are differentiated by market maturity: - Established markets: Focus on scaling enrolment through efficient lead generation and conversion optimization. - Emerging markets: Prioritize brand building, parent education, local community activation and experiential programs to educate the market and drive brand awareness first. | |||
37 | c.iv. What is considered as the acquisition cost and historically how much is the CAC per enrolled student? How the CAC trend has been in the past few years? | Yason, Yulia | ||||
38 | d. Which acquisition channels does management expect to drive future growth? | Yason, Yulia | Future student acquisition is expected to be driven by a progressively more efficient channel mix: 1. Paid Lead Generation to build the base – Continue using performance marketing to generate qualified leads and support expansion into new and underpenetrated markets. 2. Brand & Top-of-Funnel Marketing to create organic demand – Increase investment in awareness campaigns, social media, content, and KOL partnerships to strengthen brand equity, drive organic enquiries, and reduce reliance on paid acquisition over time. 3. Word-of-Mouth & Referrals to create a self-reinforcing referral engine.– As the installed student base grows, management expects parent advocacy and referrals to become an increasingly important acquisition engine, supported by consistently delivering a high-quality student and parent experience. | |||
39 | e. How does management expect CAC to evolve as SMM expands into new locations? | Yason, Yulia | ||||
40 | f. What evidence supports management’s assumption that demand remains underpenetrated in existing and target markets? | Yason, Yulia | ||||
41 | g. What are the key reasons leads do not convert into paying students? | Yason, Yulia | already aligned with SMM value but still not progressive enough to be able to accept school program and format | |||
42 | h. What are the main reasons students churn? How is the churn rate trends in the past few years? How many students did not continue to study in SMM when they graduated from elementary school or junior high school? | Yason, Yulia | ||||
43 | 2. AOV / Pricing Assumption. In the management model, AOV per student is assumed to increase year-on-year. | |||||
44 | a. What are the key drivers of the projected AOV increase: tuition price increase, higher class frequency, premium programs, or mix shift? | Inka, Yason | - peningkatan harga sekolah ~7% per tahun - proporsi jenjang yg bergerak ke jenjang yang lebih tinggi (ARPU jenjang tinggi lebih mahal) - peningkatan tier price pada hubs yg masih menggunakan tier "promo" | |||
45 | b. How frequently has SMM increased prices historically, and what was the impact on enrolment, retention, and conversion? | Yason, Yulia | - ada peningkatan signifikan (~20%) pada TA 23/24, namun growth masih tetap terjadi karena market sudah believe on the product, peningkatan ini terjadi karena penyesuaian utama dari SMM yg start di era pandemi dan online-centric menuju ke offline - dari TA 23/24 hingga saat ini (menuju TA 26/27), growth sekitar 7% per annum | |||
46 | c. What gives management confidence that parents will be receptive to further price increases? | Inka, Yason, Yulia | we usually do price increase every 2 years, and every year we improve our quality | |||
47 | d. How does SMM’s pricing compare with direct competitors in each market? | Yason, Yulia | SMM position itself as a middle category in terms of pricing, compared to the competitors | |||
48 | e. Will the projected AOV increase change the socio-economic segment that SMM is targeting? | Yason, Yulia | ||||
49 | f. Has management tested willingness-to-pay across different parent segments? | Yason, Yulia | ||||
50 | g. How does the management think about AOV and different purchasing power across different cities? | Yason, Yulia | SMM menerapkan tier-based pricing yang salah satunya mempertimbangkan UMK pada lokasi hub tersebut | |||
51 | 3. Hub Expansion Assumption. The management model assumes approximately 3-9 new hubs per year from FY26F to FY31F. | |||||
52 | a. What is the rationale behind the planned number of new hubs per year? | Inka, Yason, Yulia | - laju growth student terhadap occupancy hub - beberapa hub ada yang memiliki space lebih untuk ekspansi, namun ada yang ekspansi dalam bentuk satelit/filial - jika area tersebut masih memiliki potensi market yang tinggi, maka akan dibangun new hub di area tersebut - secara historikal, di awal pengembangan SMM, kami bisa membuka 10-15 hubs per tahun, namun dulu hub SMM relatif kecil (3-5 ruang) - saat ini target optimis kami di 3-9 hubs per tahun menimbang minimum space required saat ini di minimal 5 ruang kelas dan analisa marketing atas area tersebut sudah jauh lebih baik | |||
53 | b. How does management determine whether a location is attractive for a new hub? | Yason, Yulia | Dilakukan analisis dari demography housing, untuk memastikan kesesuaian daya beli. Lalu kita akan analisis: family lifestyle, non-school, dan school environment analysis. Memastikan market sesuai dengan target market SMM | |||
54 | c. Please provide the current location pipeline for FY26F-FY31F, including status, expected opening timeline, capex requirement, ownership/rental structure, and expected capacity. | Yason, Yulia | ||||
55 | d. Does management plan to rent or purchase land/buildings for new hubs? What is the rationale for each approach? | Inka, Sony | - dengan business model dan pricing SMM saat ini, opsi rent tetap menjadi utama untuk menjaga IRR dan payback yang attractive - opsi membeli tanah dan membuat bangunan sendiri akan sulit terjustifikasi dengan pricing SMM saat ini, sehingga konsep SMM Lab akan lebih sesuai dengan skenario ini | |||
56 | e. What are the key approval, licensing, fit-out, hiring, and operational steps required before opening a new hub? | Yason | - Penentuan Market dengan Market Fit Analysis - Menentukan prioritas market yang dituju sebagai new location - Mencari properti yang sesuai dengan kriteria SMM (dari checklist yang telah dibuat) - Melakukan feasibility study pada properti yang ada - Jika feasible, dilanjutkan ke proses legalitas dan lainnya - Melakukan hiring manpower di hub tersebut - Pra aktivasi marketing sebelum Grand Opening - Grand Opening Hub | |||
57 | f. What has been the historical timeline from site identification to hub opening? | Yason, Yulia | Proses penentuan lokasi untuk hub opening dilakukan pada Februari-Mei. Penentuan titik properti hub dilakukan pada Juni-Agustus. Renovasi September-November. Desember harapannya sudah bisa Grand Opening. Juli tahun berikutnya dimulai tahun ajaran. | |||
58 | g. Have there been delays in previous hub openings? If yes, what caused the delays and what has management done to avoid recurrence? | Inka, Yason, Yulia | Challenges: - Suitable properties often unavailable even within designated target areas. - Rental prices occasionally exceed market averages. - Building administrative paperwork/status is sometimes incomplete. Strategies: - Utilize surveyors trained specifically on SMM’s requirement list. - Refine and update the requirement list for new hubs. | |||
59 | h. Does management have sufficient internal project management capacity to execute multiple hub openings per year? | Inka, Yason | - SID memiliki tim Learning Space Development (LSDev) inhouse - secara historikal, di awal pengembangan SMM, kami bisa membuka 10-15 hubs per tahun, namun dulu hub SMM relatif kecil (3-5 ruang) - saat ini target optimis kami di 3-9 hubs per tahun menimbang minimum space required saat ini di minimal 5 ruang kelas dan analisa marketing atas area tersebut sudah jauh lebih baik | |||
60 | i. Does management have multiple contractors/vendors to support hub development? | Ibeth | ||||
61 | j. What is the expected capex per hub, and how does this compare with historical hub opening costs? | Sony | - dengan standar saat ini rentang hub development per hub sekitar 2-4 miliar, akan bergantung pada kondisi bangunan existing, luas area, dan jumlah ruang kelas - ~70% dari kebutuhan investasi untuk CAPEX dan prepaid rent | |||
62 | k. How long does a new hub typically take to reach breakeven and target occupancy? | Sony | - BEP dihitung per titik, karena variable biaya sewa dan biaya operasional hub cukup bervariasi, namun secara rentang BEP terjadi pada occupancy 35-45% - Payback period per hub berada pada rentang Y4-Y6 - target occupancy SMM memiliki pakem target occupancy berikut, Y1 30%, Y2 50%, Y3 60%, Y4 70%, Y5 80%, Y6-Y10 85% | |||
63 | l. What percentage of existing hubs achieved the original business plan within the expected timeline? | Sony | secara historikal ketidakcapaian pada Y1 cukup tinggi khususnya di area baru, namun Y2 baru menunjukan growth yang tinggi, begitu juga di Y3 sehingga compensating overall trajectory | |||
64 | m. For expansion outside Java, how does management plan to validate product-market fit before committing capex? | Yason, Yulia | ||||
65 | 4. Occupancy and Capacity Utilisation. In the model, occupancy rate is assumed to increase over time. | |||||
66 | a. Please provide current occupancy by hub, by program, and by class level. | Yason, Sony | - Occupancy per Hub | |||
67 | b. How is occupancy defined in the model: seats used, classroom capacity, teacher capacity, or scheduled class capacity? | Sony | - occupancy terhitung dari actual student to capacity student - capacity terhitung dari variabel: jam buka/tutup hub, jumlah kursi per ruang kelas, dan schedule sesi kelas per jenjang | |||
68 | c. How much of the projected occupancy increase is driven by natural cohort ramp-up versus active operational initiatives? | Yason | Murid yang telah diakuisisi 85% akan lanjut naik kelas dan bertahan menjadi murid SMM, kecuali murid naik jenjang sekitar 55%. Dan mereka pada umumnya mengenalkan SMM ke orang sekitarnya. Dari pertumbuhan murid, sekitar 30% sudah mengenal SMM karena referensi murid/ orang tua SMM. Sisanya sekitar 70% dari inisiatif marketing. | |||
69 | d. What specific actions will management take to improve occupancy in underutilised hubs? | Inka, Yason, Yulia | - Analisis ulang data market - Penempatan kepala sekolah dan sales dari Jakarta atau yang sudah lebih berpengalaman - Menguatkan aktivasi komunitas parenting di sekitar hub - Iklan di sosial media | |||
70 | e. What is the minimum occupancy required for a hub to break even? | Sony | - bergantung pada variable "location expense" yg paling major rent - rentang wajarnya 35%-45% | |||
71 | f. Is there any operational constraint that limits occupancy, such as classroom availability, teacher availability, scheduling, or student demand? | Sony, Yason | sistem mixed aged & flexible scheduling di SMM sangat membantu dan menjadi break-through dari issue pemenuhan rombongan belajar di setiap sesi kelas | |||
72 | g. Please provide the number of classes offered per hub and the average students per class. | Sony | - # of classrooms per hub - perhitungan average student per classroom tidak relevan dengan konsep SMM yg flexible scheduling | |||
73 | 5. Teacher Pipeline and Academic Quality | |||||
74 | a. What is the overall strategy to ensure expansion is supported by consistent high quality education professionals? | Inka, Yason | ||||
75 | b. What is the current teacher-to-student ratio, and what ratio is assumed in the model? | Yason, Sony | PAUD 1:8, SD 1:12, SMP & SMA 1:15 | |||
76 | c. How many teachers need to be hired annually to support the expansion plan? | Yason, Jaim | Berdasarkan histori, terdapat penambahan guru baru sekitar 100 orang setiap tahunnya. Tahun 25/26 SMM memiliki 500an guru, tahun 26/27 SMM membutuhkan 600an guru | |||
77 | d. What is the current teacher recruitment funnel: applicants, shortlisted candidates, accepted candidates, and trained teachers? | Yason, Jaim | The teacher recruitment funnel are: screening CV - online assessment - micro/demo teaching - interview HR & user (headmaster) - check reference - offering - employee agreement - onboarding | |||
78 | e. How long does it take to recruit, train, and deploy a new teacher? | Yason, Jaim | the duration for teacher growth process are around 6-8 weeks, the details are: - Recruit: 2-4 weeks - Onboarding/training: 1-2 weeks - Deploy: 1 week | |||
79 | f. What is the annual teacher turnover rate? | Yason, Jaim | The annual teacher turnver rate is 7,56% | |||
80 | g. What is the average teacher tenure? | Yason, Jaim | The average teacher tenure is 2 years | |||
81 | h. How does management ensure teaching quality remains consistent as the number of hubs increases? | Yason, Jaim | - Standardised curriculum, assessment and platform - Development & certification teacher skill and competencies - Observation & feedback cycle - Regional supervision layer | |||
82 | i. Is the business dependent on certain key teachers, academic leaders, or founders? | Inka, Yason | ||||
83 | j. What training, certification, and performance monitoring systems are in place for teachers? | Inka, Yason, Jaim | Training, certification and PMS for all teacher documented in Teacher Portofolio. Teachers receive structured onboarding, mandatory and continuous professional development through workshops, mentoring, coaching, and an LMS to enhance both general and technical teacher competencies. While, Performance checkpoint conducted also every term using 360 methods (evidence self report, review form headmaster, and observer). | |||
84 | 6. SMM Unit Economics | |||||
85 | a. How does the management look into the unit economics at hub level? Is profitability monitored at school/hub level, area, city, or aggregate? | Inka, Sony, Yason | "rapotan" (financial evaluation) dilakukan pada level hub, product cluster, dan business units | |||
86 | b. Please provide the breakdown of COGS for SMM offline and online programs | Sony | sample program cost jenjang SD | |||
87 | c. What are the key fixed and variable costs at the hub level? | Sony | variable cost: guru & LMS fee fixed cost & expense: hub rent, hub ops, hub personnel, marketing, head office allocation | |||
88 | d. What is the payback period for a new hub? | Sony | pada rentang Y4-Y6 | |||
89 | e. What is the expected EBITDA margin of a mature hub? | Sony | - jika termasuk alokasi head office, sekitar 35-45% - jika exclude alokasi head office, sekitar 55% | |||
90 | f. How sensitive is hub profitability to changes in occupancy, pricing, teacher cost, and rent? | Sony | - cost guru terhadap occupancy kurang relevan dan terjaga karena mixed age & flexible schedule, potensi issue terbesar akibat keterisian rombongan belajar dibandingkan occupancy - rent terhadap occupancy sangat signifikan, terlihat dari target BEP pada occupancy 35-45% yang utamanya di drive oleh hub rent, hub ops, dan hub personnel | |||
91 | 7. Product/Service Quality | |||||
92 | a. How does management measure student learning outcomes? | Yason | Penilaian dari laporan belajar di setiap program (triwulan dan semester), serta rapor murid setiap semesternya. Akademik SMM menganalisis perkembangan kompetensi murid, completion program, rata-rata nilai per mata pelajaran, dan lain sebagainya. | |||
93 | b. Are there standardised tests, progression metrics, parent satisfaction surveys, or external certifications? | Yason | SMM melakukan survey kepuasan orang tua setiap semester, murid SMP-SMA juga melakukan penilaian terhadap guru setiap semester. Dashboard capaian akademik juga setiap semester akan dipantau dan dianalisis untuk melihat perkembangan capaian murid. | |||
94 | c. What percentage of students show measurable improvement after joining the program? | Yason | Setiap tingkat memiliki target perkembangan dan target capaian kompetensi yang harus diraih. Rata-rata kompetensi murid PAUD hingga SMA SMM setiap tahunnya berkisar dari 76-81. Target metriks rata-rata kompetensi adalah 75, sehingga dapat disimpulkan rata-rata murid SMM melampaui target dalam capaian kompetensi. | |||
95 | d. How does SMM ensure curriculum consistency across different hubs and teachers? | Yason | - Teachers training setiap 3 bulan - Koordinasi kepala sekolah SMM 2x setiap minggu - Koordinasi guru dengan koordinator akademik 2x setiap minggu - Koordinasi guru dengan kepala sekolah di hub 1x setiap minggu - Rapat kerja seluruh tim hub 1x setiap semester - Teacher Performance Review 1x setiap semester, dengan asesor lintas cabang pada umumnya - Training Kepala Sekolah 1x setiap semester - Rapat dan penyusunan program dan target Learning Coordinator dan Learning Designer: 1x setahun | |||
96 | e. Who develops the curriculum, and how often is it updated? | Yason | Tim Akademik SMM internal secara konsisten menyusun, mengevaluasi, dan memonitor kurikulum di SMM. Kurikulum disusun setiap satu tahun ajaran, namun kerangka kurikulum baru dimungkinkan terjadi. Perubahan lingkar kurikulum (kerangka utama) berdasarkan pengalaman diupdate setiap 3-4 tahun sekali untuk memastikan kurikulum tetap relevan dengan kebutuhan dunia. | |||
97 | f. Does SMM own the curriculum and learning materials, or are they dependent on third-party content? | Yason | SMM memiliki sendiri kurikulum serta materi pembelajarannya. Kita tidak bergantung pada pihak ketiga, dan pihak ketiga hanya membantu untuk menyediakan tools saja. Semua rancangan dikembangkan oleh tim internal SMM. | |||
98 | g. What is the process for handling parent complaints, teacher underperformance, and student dissatisfaction? | Yason | - Complaints dapat disampaikan melalui jalur komunikasi orang tua melalui guru ataupun media Parents Care (WA/ email) - tim yang berkaitan akan merespon - Kepala Sekolah akan menganalisis apakah perlu untuk menangani secara langsung. - Masalah guru yang kurang perform ataupun ketidakpuasan murid juga akan ditanangani oleh kepala sekolah - Jika kepala sekolah memerlukan bantuan, Regional Manager ataupun Manager Akademik, ataupun Koordinator Kurikulum akan membantu - Jika diperlukan bantuan lebih lanjut, Direktur Sekolah dan Direktur Akademik juga akan membantu | |||
99 | h. Please provide historical NPS, parent satisfaction, complaint rates, and refund data, if available. | Yason | Data survey kepuasan SMM S1 Ta 25/26: - Hub Facilities Rating 3.43/4 - Teacher Performance Rating 3.62/4 - Learning Method Rating 3.53/4 - Service Communication Rating 3.49/4 Deck analisis survey: [DATA] Analisis Survey Kepuasan SMM _ S1 TA 25/26 | |||
100 | ||||||
101 | ||||||
102 | C. KTM | |||||
103 | 1. Client Growth Assumption. In the management model, KTM revenue growth is driven by an increase in number of clients and project value | |||||
104 | a. Please provide historical client data for the past 3 years, including new clients, repeat clients, lost clients, and revenue per client. | Leaders KTM | Mengingat brand KTM sendiri baru efektif digunakan Agustus 2025, Data yang tersedia untuk KTM hanya data TA 25/26 dengan rincian sbb: Deal Won - New Client: 73 Companies (7,17 Bn. Avg. order value/companies 0.09Bn) - Existing: 116 Companies (26.4 Bn. Avg. order value/companies 0.22Bn) Deal Lost - New Client: 326 Companies (47,9 Bn. Avg. order value/companies 0.14Bn) - Existing: 105 Companies (33,98 Bn. Avg. order value/companies 0.32Bn) | KTM Data_June 26 2026.xlsx | ||
105 | i. From the existing client database, can the management specify its status (e.g. active vs non-active; paying vs non-paying, etc.), annual spending for the KTM, type of engagement (annual contract, multi-year contract, pay per use, etc.) | Leaders KTM | Saat ini hanya track: - Status/Type: New or existing business - Annual spending (dihitung dari total deal selama satu tahun) | |||
106 | b. What percentage of revenue comes from new clients versus repeat clients? | Leaders KTM | Based on Zoho data as of June 26th 2026 New Clients: 21.37% (7.17 Bn) Existing Clients: 78.63% (26.4 Bn) | |||
107 | c. What is the average client tenure? | Leaders KTM | Data belum tersedia, karena data histori transaksi sebelum TA 25/26 belum ter-compile dari 3 business unit berbeda | |||
108 | d. What is the strategy to acquire new clients? Please explain the current acquisition process | Leaders KTM | Strategy Enhance Foundation - Strengthen SID & Fellowship internal program (captive and protected market) - SID & Fellowship become a product and service Lab to assess new product and services - Improve revenue contribution by right-fit pricing strategy (revisit cost structure) - Robust Organization Structure (attacking mode), collaborative mindset and shared KPI Turn Around Performance - Rebalance client's portfolio by deepening relationship with existing clients and expand new clients (growth 15%) Develop customized and new product and services (Integrated) by optimizing existing product - Improve revenue with >45% (avg) profit margin - Focus on certain winning industries in core segment and new business – Focus on Banking, Pharmaceutical, Hospitality, Hospital and Mining through building ecosystem. - Open and Transparent Business Progress (Regular Basis) – everyone is accountable Seize Growth Opportunity - Refine Partnership program to support business ambition with ‘clear’ holistic approach. - Establish a solid and strong relationship with Clients - Refine university/campus curriculum or program (especially, assessment) that led to future ready - Deepen SYNERGY with SID & Fellowships to become our partner to grow Explore New Landscape - Develop innovative future capabilities in Industry (Future Skills) and University/Campus (Readiness Level) - Strengthen consultation compartment to become new competitive advantage - Refine publication business to support company branding and also parent branding – Say, Stay & Strive - Develop ‘marketplace’ for Consultant, Facilitator and Sales to reduce dependency to those 3 roles Business Process | |||
109 | d.i. Who is responsible for the new client acquisition and manage existing clients? | Leaders KTM | Commercial Team yang bertanggung jawab terhadap akusisi dan mempertahankan klien dengan berkerjasama dengan seluruh unit, khususnya Konsultan dan Project Managment. | |||
110 | d.ii. How is the sales team structured? How many sales team does KTM currently have? | Leaders KTM | Commercial Team memiliki 4 (Empat) tim Business Solution yang dipimpim 4 Leaders dan memiliki tim dengan total 6 BS, sehingga total tim BS adalah 10 yang memiliki target tim dan individu. disamping BS, Commercial Team juga memiliki Client Success (2 orang) yang untuk memastikan post-sales (adoption dan renewal/top-up/anti-attrition) dan pada TA 26/27 ditambahkan Leads Activator (1 orang) yang berfokus pada pre-sales untuk klien baru/inactive/loss. | |||
111 | d.iii. How does the sales process look like? develop pipeline, gather leads, until sign new clients | Leaders KTM | Terlampir end-to-end sales process (Current and Proposed) | [WIP] Commercial Team Update _ June 2026 | ||
112 | d.iv. How long does the sales process take from approaching client to close a contract? | Leaders KTM | Sales Process sangat bervariasi tergantung dari jenis solusi; - SaaS Solution, rerata end-to-end process dibawah 5 hari - Integrated Solution, rerate end-to-end sales process sekitar 14 hari, pada kasus yang lebih complex sekitar 30 hari | |||
113 | d.v. How does the team calculate CAC for KTM? How does the CAC look like in the past few years? | Leaders KTM | Alokasi untuk CAC didapatkan dengan mengoptimalkan biaya Marketing dengan mengadakan Client Gathering, Edukasi online, Adds dll yang diangarkan 5% dari target revenue. | |||
114 | e. What is the strategy to retain and expand existing clients? | Leaders KTM | Business - Better business core (Cross, Deep & Up - Selling). PPC x to 3. - Broader portfolio (Focus to Segment Champion and divided into portfolio approach base). 100% contacted. - Bigger reach (Explore New & Unexplored Landscape - Region Focus). Revenue generated IDR 5Bn Operation - Technology Excellence (Leveraging our ‘tech’ as a ‘first’ touch base) - 2K units as retention or acquisition startegy - Operation Resilience (Operation Excellence) - Cost Effectiveness Reduce 10% from budget - Delivery + 1 (Service Excellence with high standard of quality)-NPS 85 (Participant) People - Strongest Best People (Learning, Buddy, Networking) - 40 hours/year - Performing for Commitment to Excellence (Shared KPI and Collaborative Incentive Scheme) - Performance Distribution min.70% - Client centric organization (Reliable Business Partner) - NPS 60 (C-level/C-1/PIC) | |||
115 | f. What are the main sales channels today and how does the proportion look like: founder relationships, internal sales team, referrals, partnerships, digital marketing, or tenders? If founder-led relationships are excluded, what is the demonstrated sales capability of the broader team? | Leaders KTM | Kanal penjualan yang utama saat ini dihasilkan dari Internal Sales (relationship) dengan memaksimalkan relasi dari BS dan KTM Leaders. Maka, kapabilitas yang utama adalah kemampuan sebagai konsultan yang dapat memahami kebutuhan dan menciptakan kebutuhan dari klien. | |||
116 | g. What is the historical proposal win rate by service line? | Leaders KTM | Based on product cluster from Proposal Sent to Won - SaaS (ATS & Psychotest): 81% - Integrated Solutions (Others): 80% | |||
117 | h. What is the average sales cycle by service line: psychotest, virtual assessment center, and consulting projects? | Leaders KTM | Berdasarkan data yang diinput oleh tim sales pada CRM, rata-rata sales cycle adalah sbb: - psychotest: 26 Days - Virtual Assessment: 27 Days - Consulting Project: 49 Days | |||
118 | i. Please provide the current client pipeline for FY26F, including pipeline value, probability of closing, expected timing, and responsible relationship owner. | Leaders KTM | 2026 Pipeline total (as of June 27): 25.22 Bn | KTM Data_June 26 2026.xlsx | ||
119 | j. For FY27F-FY31F, what assumptions support the projected client growth? | Leaders KTM | Dengan penerapan Portfolio Management untuk setiap Tim BA, Pemberlakuan Account Management untuk setiap BS sehingga dapat memasikmalkan cross-selling, deep-selling, up-selling. | |||
120 | 2. Revenue Concentration and Quality | |||||
121 | a. What percentage of revenue is contributed by the top 5 and top 10 clients? | Leaders KTM, Andreas | 58.71% revenue contributed by top 10 companies | [CONFIDENTIAL] Revenue List KTM 2025 | ||
122 | b. Are there any clients contributing more than 10% of revenue? | Leaders KTM, Andreas | Yes, 2 companies through multiple project in 2025: - BSI Maslahat: 4.1 Bn - Bank Indonesia: 3.5 Bn | [CONFIDENTIAL] Revenue List KTM 2025 | ||
123 | c. How much revenue is recurring, repeat project-based, or one-off? | Leaders KTM | Potensi recurring/repeat sekitar IDR 10Bn -15Bn | |||
124 | d. How much of FY26F projected revenue is already contracted, under negotiation, or still uncommitted? | Leaders KTM | Potensi sampai dengan FY26F sekitar IDR 25Bn - 35Bn | |||
125 | e. What are the key reasons clients stop using KTM’s services? | Leaders KTM | For existing clients, based on revenue lost: - Lost to competition (5.3 Bn) - Pricing (2.2 Bn) - Not providing any response (usually due to minimum needs, 1.22 Bn) | |||
126 | 3. Project Value Assumption. The model assumes an increase in project value over time. | |||||
127 | a. What are the key drivers behind the projected increase in project value? | Sony, Leaders KTM | Berfokus pada strategy yang menitik beratkan Business, Operation dan People sebagai key levers. | |||
128 | b. Is the increase expected to come from larger clients, higher pricing, broader project scope, bundled services, or more complex consulting engagements? | Leaders KTM | Pendekatan pada TA baru akan berfokus pada penambahan jumlah potensial klien berdasarkan choosen market/segment (pendekatan Portfolio Management dan Account Management) dengan memberikan solusi yang 'integrated' sehingga dapat menambah PPC (Product Per Customer). | |||
129 | c. Please provide historical average project value by service line. | Leaders KTM | 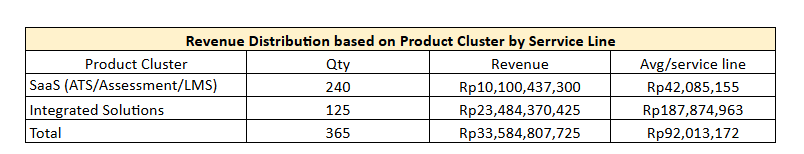 | KTM Data_June 26 2026.xlsx | ||
130 | d. How does KTM price each service line? | Sony, Leaders KTM | product pricing KTM | |||
131 | e. How does KTM’s pricing compare with competitors? | Leaders KTM | Secara keseluruhan masih cukup bersaing dan KTM akan memperbaiki pada systmen pricing pada business 'Development' (Training) agar dapat menjangkau market yang lebih massive/retail. | |||
132 | f. What evidence supports management’s ability to increase project value? | Leaders KTM | Kami melakukan perubahan dalam organisasi, skema incentive, business process dan cara kerja. sehingga dari perubahan tersebut dapat menghasilkan pole kerja yang berbeda, kedepan KTM akan fokus pada Cross-Selling dan Deep-selling untuk segment Banking, Mining, Hospitality dan beberapa winning industry yang memiliki 'buying power' pada situasi ekonomi saat ini. Pada sisi yang lain KTM akan mengoptimalkan dan menambah kanal 'Partnership' terutama untuk produk SaaS. | |||
133 | g. What percentage of clients purchase more than one service? | Leaders KTM | Total Klien = 189 Klien Purchased >1 Servis = 66 Persentase = 34,9% | KTM Data_June 26 2026.xlsx | ||
134 | 4. Competitive Positioning | |||||
135 | a. Who are KTM’s main competitors in psychotest, assessment center, and HR consulting? | Leaders KTM | Assessment: Talentytica, SHL Consulting: DDI, GML, ACT, Mercer, Gallup, Thomas Learning: Kubik, Cias, Dunamis, Experd CSR / ESG Consulting: Socialimpact.ID, Olahkarsa Sebagian besar kompetitor memiliki spesialisasi pada satu atau dua area layanan. KTM Solutions hadir dengan pendekatan yang lebih terintegrasi, menghubungkan assessment, consulting, learning, technology, dan sustainability dalam satu ekosistem yang mendukung pertumbuhan individu sekaligus pertumbuhan organisasi secara menyeluruh. | |||
136 | b. Why do clients choose KTM over other HR service providers? | Leaders KTM | Klien memilih KTM Solutions terutama karena adanya trust yang sudah terbentuk, baik melalui hubungan personal dengan leaders/karyawan KTM, referral dari klien sebelumnya, maupun pengalaman langsung terhadap cara kerja KTM melalui pendekatan Growth Circuit. Kepercayaan tersebut diperkuat oleh kemampuan KTM dalam menyediakan solusi Talent & Organization Growth secara end-to-end, melalui integrasi layanan Assessment, Learning, dan Consulting. Keunggulan KTM juga didukung oleh platform teknologi milik sendiri, metodologi yang terintegrasi, serta kapabilitas CSR/ESG Consulting, sehingga mampu mendukung pertumbuhan talenta sekaligus pertumbuhan organisasi secara berkelanjutan. | |||
137 | c. What is KTM’s key differentiation: price, quality, speed, technology, psychologist network, methodology, or industry expertise? | Leaders KTM | Diferensiasi utama KTM Solutions terletak pada: - Metodologi terintegrasi melalui KTM Growth Circuit. - Platform teknologi milik sendiri, sehingga memungkinkan fleksibilitas untuk client. - Jaringan tenaga ahli multidisiplin (psikolog, assessor, trainer, konsultan, dan spesialis ESG). - Kapabilitas CSR/ESG Consulting sebagai pelengkap solusi pengembangan organisasi. | |||
138 | d. Are KTM’s services scalable, or do they depend heavily on senior consultant involvement? | Leaders KTM | Ya. Layanan KTM Solutions dapat diskalakan, terutama melalui produk SaaS yang dikembangkan dengan teknologi milik sendiri. Untuk integrated solutions, skalabilitas juga dapat dicapai dengan tambahan kapasitas operasional. Beberapa layanan seperti Virtual Assessment Center, Recruitment Process Outsourcing (RPO), dan berbagai program learning dapat dijalankan oleh tim delivery (non permanent atau associate) yang telah terstandarisasi. Senior consultant difokuskan pada proyek yang lebih strategis dan kompleks, seperti transformasi organisasi, penyusunan sistem SDM, dan advisory. | |||
139 | e. What are the main reasons KTM loses pitches or proposals? | Leaders KTM | Pricing, portfolio/pengalaman menangani project sejenis yang belum mencukupi. | |||
140 | 5. Delivery Capacity and Margin | |||||
141 | a. Does KTM have sufficient consultant and psychologist capacity to support the projected growth? | Leaders KTM | Kami masih membutuhkan beberapa senior consultant apabila project semakin meningkat. | |||
142 | b. What is the utilisation rate of consultants and assessors today? | Leaders KTM | Saat ini, tingkat utilisasi internal consultant telah berada pada level yang tinggi. Indikasinya terlihat dari tingginya pencatatan jam kerja di luar jam kerja normal (overtime) pada tim delivery, baik konsultan maupun project team. Hal ini menunjukkan bahwa kapasitas internal telah dimanfaatkan secara optimal dan mulai mendekati batas maksimal. Sementara itu, apabila yang dimaksud adalah associate consultant dan associate assessor (tenaga eksternal), tingkat utilisasinya masih berada pada level yang sehat. Selain itu, pool konsultan dan asesor eksternal terus bertambah, sehingga kapasitas untuk mendukung peningkatan volume proyek juga semakin baik dan lebih fleksibel. | |||
143 | c. How many additional consultants, assessors, or psychologists need to be hired to support the plan? | Leaders KTM | Diperlukan beberapa tambahan senior consultants, namun untuk sementara kita memilih strategi untuk membangun dan mengelola associate pool agar jumlahnya memadai serta kualitas kompetensinya tetap konsisten dengan standar KTM, sampai kita mencapai kondisi revenue yg stabil. | |||
144 | d. What is the gross margin by service line? | Sony, Leaders KTM | data product margin | |||
145 | e. Which service lines are most profitable? | Sony, Leaders KTM | data product margin | |||
146 | f. How does margin change as KTM scales? | Sony, Leaders KTM | - pada produk asesmen, kenaikan volume dapat meningkatkan margin karena server cost bersifat semi-fixed - pada produk consulting, kenaikan volume tidak terlalu meningkatkan margin (selain biaya head office) | |||
147 | g. What operational bottlenecks could limit KTM’s ability to deliver larger project volumes? | Leaders KTM | Jika volume proyek meningkat secara signifikan, tantangan operasional utama adalah keterbatasan kapasitas tim delivery internal apabila seluruh proyek dikerjakan secara in-house. Namun, dengan mekanisme pemanfaatan external project manager dan associate consultant, KTM memiliki fleksibilitas untuk menangani volume proyek yang lebih besar. Oleh karena itu, tantangan yang lebih strategis adalah membangun dan mengelola associate pool agar jumlahnya memadai serta kualitas kompetensinya tetap konsisten dengan standar KTM. | |||
148 | 6. Product Quality | |||||
149 | a. Are KTM’s psychotest and assessment tools validated? | Leaders KTM | Ya. Dilakukan uji validitas dan reliabilitas secara psikometrik, dengan evaluasi (kalibrasi) tahunan dan pengkinian norma. | |||
150 | b. Are the assessment methodologies proprietary, licensed, or adapted from third parties? | Leaders KTM | Tidak. Seluruh asesmen yang digunakan oleh KTM adalah hasil pengembangan mandiri (in house) oleh tim psikometrik internal. Asesmen juga didaftarkan Hak Ciptanya ke HKI. | |||
151 | c. Are KTM’s psychologists and assessors certified under relevant professional standards? | Leaders KTM | Ya, seluruh asesor yang ditugaskan dalam setiap proyek asesmen yang berada di bawah naungan KTM telah memiliki sertifikasi. Mayoritas asesor tersebut memperoleh sertifikasi dari PPM, LPT UI, dan HIMPSI Jaya. | |||
152 | d. What evidence does KTM have that its assessments improve client hiring, promotion, or talent decisions? | Leaders KTM | Berdasarkan hasil studi yang dilakukan bersama dengan klien, misalnya dengan menggunakan metrik: - peningkatan success rate seleksi - percepatan SLA seleksi/asesmen | |||
153 | e. Has KTM received any major client complaints or disputes regarding assessment accuracy or project quality? | Leaders KTM | Ada 1 komplain dari klien, namun tidak dapat dikategorikan major karena tidak sampai dispute; dan sudah solved statusnya. Salah satu klien lama kami awalnya masih memakai versi penilaian versi terdahulu, sehingga memengaruhi akurasi datanya. Begitu klien menghubungi kami, tim langsung memeriksa sistem mereka dan menyesuaikannya ke versi terbaru. Kami juga membantu proses konversi hasil penilaian sebelumnya agar data yang digunakan untuk evaluasi saat ini jadi lebih akurat | |||
154 | f. What customer feedback, NPS, renewal rate, or repeat purchase data supports KTM’s value proposition? | Leaders KTM | As of June 2026 from ChurnZero: CSAT: 84.09 (11 Respondents) NPS: 67 (6 respondents) | KTM Data_June 26 2026.xlsx | ||
155 | ||||||
156 | ||||||
157 | D. Living English | |||||
158 | 1. Student Growth Assumption. In the management model, Living English student enrolment is assumed to increase year-on-year. | |||||
159 | a. How does the management think of the acquisition strategy? What are the key 3-5 strategies in student acquisition? E.g. acquisition by channel, by education level, by target segment, etc. | Inka, Haris, Yulia | Living English's student acquisition strategy is built on five key pillars. - First, we leverage the broader Sekolah.mu ecosystem, schools, and parent communities to acquire students efficiently. - Second, we employ segmented acquisition strategies based on education level and parent personas, recognizing that parents have different motivations across preschool, kids, and teens. - Third, we operate a digital-first omnichannel model combining paid media, CRM, and social media to scale lead generation. - Fourth, as a project-based learning provider, we emphasize experience-led conversion through trial classes, project showcases, and holiday programs, allowing parents to experience our differentiated pedagogy directly. - Finally, we drive sustainable growth through referrals and community advocacy, which provide high conversion rates and lower customer acquisition costs. Together, these strategies create a scalable and diversified acquisition engine that supports year-on-year enrolment growth. | |||
160 | b. What are the key drivers behind projected student growth: higher leads, improved conversion, new programs, or improved retention? | Haris, Yulia | Growth is not solely dependent on acquiring new students. Approximately, a meaningful portion of annual enrolment is expected to come from retained students progressing through higher levels, which creates a more predictable and capital-efficient growth model | |||
161 | c. Please provide historical student enrolment, leads, conversion rate, and retention data for the past 3 years. | Haris, Yulia | ||||
162 | c.i. How many available seats were available across the country? How many leads were generated? What is conversion from leads to enrolled students | Haris, Yulia | ||||
163 | c.ii. What are the key acquisition channels? What is the contribution proportion for each channel for enrolled student? Which channel has the highest leads generation and highest conversion rate? Why? | Haris, Yulia | ||||
164 | c.iii. How is the student acquisition different in 1st tier vs 2nd tier cities; in Java and outside Java; new locations vs established locations? | Haris, Yulia | ||||
165 | c.iv. What is considered as the acquisition cost and historically how much is the CAC per enrolled student? How the CAC trend has been in the past few years? | Haris, Yulia | ||||
166 | d. Which acquisition channels does management expect to drive future growth? | Haris, Yulia | Management expects future growth to be driven by four primary acquisition channels: digital marketing, the SID ecosystem, community partnerships, and referrals. While digital channels provide scale, community and ecosystem channels generate highly qualified leads through trusted relationships with parents, schools, and learning communities. Over time, management expects referrals and community-driven acquisition to become increasingly important contributors to sustainable growth. | |||
167 | e. How does management expect CAC to evolve as Living English expands into new locations? | Haris, Yulia | ||||
168 | f. What gives management confidence that Living English can continue growing in a market with many established English learning providers? | Haris, Yulia | ||||
169 | g. What are the main reasons students choose Living English? | Haris, Yulia | Based on parent feedback, the primary reason families choose Living English is the confidence students develop in using English. Through project-based learning, presentations, and exhibitions, students regularly demonstrate their learning publicly, resulting in visible improvements in communication skills and self-confidence. Parents also value our focus on future competencies and our experiential, non-traditional learning approach. | |||
170 | h. What are the main reasons leads do not convert? | Haris, Yulia | While price sensitivity remains the largest conversion barrier, we believe this is partially offset by our differentiated value proposition. As brand awareness and understanding of project-based learning increase, management expects conversion rates to improve over time | |||
171 | i. What are the main reasons students discontinue? How is the churn rate trends in the past few years? How many students did not continue to study in Living English | Haris, Yulia | ||||
172 | 2. Market Saturation and Differentiation. The English learning market appears highly competitive and potentially saturated. | |||||
173 | a. Who are Living English’s direct competitors in each target market? | Haris | LE competes with premium English course providers such as EF and Sparks; online platforms such as Ruangguru and Cakap; as well as numerous local English centers. However, we believe our closest competitive set is relatively limited because Living English combines English learning with project-based pedagogy and future competencies development. This positions us within the emerging future-ready education segment rather than the traditional test-preparation market. | |||
174 | b. Why would parents or students choose Living English over larger and more established providers? | Haris | We respect established providers such as EF or Sparks, which have built strong brands over many years. However, Living English differentiates itself through its explicit integration of project-based learning and future competencies into the curriculum. Our learning experience is intentionally designed around authentic projects and community contexts, enabling students to practice English while developing broader competencies required in the future workforce and society. | |||
175 | c. What is Living English’s key differentiation: curriculum, teacher quality, price, location, learning outcome, brand, flexibility, or niche customer segment? | Haris | We believe our strongest differentiation lies in three areas. First, our project-based curriculum enables students to learn English through authentic, real-world experiences rather than traditional paper-based instruction. Second, our learning outcomes extend beyond language proficiency to include future competencies such as communication, collaboration, creativity, and critical thinking. Third, we serve a growing segment of parents seeking future-ready, holistic education rather than purely exam-oriented English courses. | |||
176 | d. How does Living English’s pricing compare with competitors? | Haris | We believe our ability to sustain premium pricing comes from our differentiated curriculum, project-based pedagogy, future competencies framework, and strong parent engagement. Parents are increasingly willing to invest in programs that prepare their children not only to speak English, but also to thrive in a rapidly changing future. Range price 500k/month - 1.1mio/month | |||
177 | e. What customer segment is Living English targeting, and is this segment large enough to support the model? | Haris | LE serves learners across multiple life stages, from preschool to adulthood; allowing us to increase customer lifetime value while expanding our addressable market beyond the traditional K-12 English course segment. | |||
178 | f. What evidence suggests that the market is not already saturated in the planned expansion areas? | Haris | The market may be competitive, but it is not saturated for differentiated, future-ready education providers. Our ecosystem-led expansion model further reduces market entry risk and validates demand before scaling into new areas. | |||
179 | 3. AOV / Pricing Assumption. In the management model, AOV is assumed to increase year-on-year. | |||||
180 | a. What are the key drivers of AOV increase: price increase, higher class frequency, premium courses, test preparation, adult programs, corporate programs, or cross-selling | Haris | Management expects AOV expansion to be driven predominantly by expanding customer lifetime value through new programs and cross-selling, rather than relying on aggressive tuition increases. | |||
181 | b. How frequently has Living English increased pricing historically? | Haris | Historically, Living English reviews pricing periodically, typically aligned with the academic year cycle. Pricing adjustments have been moderate and value-driven, reflecting curriculum enhancements, inflation, and improvements in the learning experience. Management does not rely on significant price increases as a key growth driver. | |||
182 | c. Is there a risk that price increases make Living English less competitive versus alternative providers? | Haris | We believe parents buy outcomes, not simply tuition fees; therefore, maintaining differentiated educational value is more important than being the lowest-priced provider | |||
183 | d. Has management conducted willingness-to-pay analysis by customer segment? | Haris, Yulia | Our experience to date indicates that families from national-plus and progressive education backgrounds have shown willingness to pay for differentiated educational experiences that combine English proficiency with future competencies development. This is evidenced by continued enrolment, retention, and demand for premium educational offerings within our existing ecosystem. | |||
184 | 4. Center / Hub Expansion Assumption. The model assumes expansion through additional hubs/centers. | |||||
185 | a. What is the overall strategy to ensure expansion is supported by consistent high quality education professionals? What is the hiring teacher hiring strategy? | Inka, Haris, Jaim | - the overall strategy to ensure expansion is supported by consistent high quality education professionals 1. Create standardisation english teacher profile 2. Built pipeline & talent pool 3. Create career path and progression to retain quality -- the hiring teacher hiring strategy: 1. Sourcing - campus/university partnership, employee referral, internal talent pool and english club/community. 2. Selection - english score qualification (IELTS) and English-proficiency threshold (CEFR-referenced) for instructional roles. the selection process are: screening CV, online assessment, interview with HR and user, demo teaching. 3. Employement model - use mix employement that is permanent, contract & freelance | |||
186 | b. What is the expansion plan by city, format, and year? | Haris | Our expansion strategy is ecosystem-led and asset-light first. We prioritize markets where demand has already been validated through our ecosystem and only scale further once target unit economics are achieved. | |||
187 | c. Please provide the location pipeline, including current status, opening timeline, expected capacity, capex, and rent. | Haris, Yulia, Sony | ||||
188 | d. What criteria does management use to select a new Living English location? | Inka, Haris | ||||
189 | e. What has been the historical timeline from site identification to opening? | Haris, Yulia | ||||
190 | f. How long does a new hub take to reach breakeven and mature occupancy? | Sony, Haris | - BEP pada shared hub 16-35% - BEP pada dedicated hub 21% | |||
191 | g. What is the expected payback period for a new hub? | Sony | untuk dedicated hubs Y4-Y5, untuk shared hubs relatif negligible karena menggunakan asset yg sama seperti SMM | |||
192 | h. What is the capex per new hub, and how does this compare with historical cost? | Sony | untuk dedicated hubs ~3 bn, untuk shared hubs <100mn | |||
193 | i. Has Living English historically opened new hub successfully within budget and timeline? | Sony | - hub LE memiliki timeline yang fleksibel karena enrollment bisa dilakukan kapanpun - budget-wise relatif mirip dengan hub SMM untuk 2 dedicated hub LE | |||
194 | j. For new cities, how will management test demand before committing to a full hub? | Haris, Yulia | ||||
195 | k. Does management have enough teachers and hub managers to support the expansion plan? | Inka, Haris | ||||
196 | 5. Occupancy and Unit Economics | |||||
197 | a. What is the breakeven occupancy per hub? | Sony | - BEP pada shared hub 16-35% - BEP pada dedicated hub 21% | |||
198 | b. Please provide hub-level P&L for existing hub. | Andreas | Updated -> | Copy 15 Jun [CONFIDENTIAL] Rapotan SMM-TMR Location Wise 25/26 WP | ||
199 | c. What are the main fixed and variable costs? | Sony | variable cost: guru & LMS fee fixed cost & expense: hub rent, hub ops, hub personnel, marketing, head office allocation | |||
200 | d. What is the gross margin and EBITDA margin by program? | Sony | data program margin | |||
201 | e. How sensitive is profitability to student growth, AOV, teacher cost, and rent? | Sony | - cost guru terhadap occupancy kurang relevan dan terjaga karena mixed age & flexible schedule, potensi issue terbesar akibat keterisian rombongan belajar dibandingkan occupancy - rent terhadap occupancy sangat signifikan, terlihat dari target BEP pada occupancy 21% yang utamanya di drive oleh hub rent, hub ops, dan hub personnel | |||
202 | 6. Product/Service Quality | |||||
203 | a. How does management measure student learning outcomes? | Haris | LE measures learning outcomes through a combination of LMS-based learning analytics, curriculum assessments, and authentic project-based evaluations. Our LMS enables continuous tracking of student progress, while end-of-term projects and exhibitions allow students to demonstrate the practical application of English and future competencies in real-world contexts. We also monitor retention, progression rates, and parent satisfaction as additional indicators of program quality. | |||
204 | b. Are there standardised tests, progression metrics, parent satisfaction surveys, or external certifications? | Haris | LE measures educational quality through a combination of LMS-based progression metrics, curriculum assessments aligned with CEFR standards, project-based exhibitions, and parent feedback mechanisms. In addition, our partnership with Cambridge enables us to incorporate internationally recognized assessment and certification pathways, providing external validation of student achievement. | |||
205 | c. What percentage of students show measurable improvement after joining the program? | Haris | We already measure learning outcomes extensively at the student level. Our next step is to aggregate these outcomes into standardized enterprise-wide impact metrics as the business scales | |||
206 | d. How does Living English ensure curriculum consistency across different hubs and teachers? | Haris | We maintain curriculum consistency through a centralized curriculum, standardized teaching resources, LMS-enabled learning delivery, and ongoing teacher training. In addition, regular academic monitoring, classroom observations, and project reviews ensure that students across all hubs receive a consistent and high-quality learning experience. | |||
207 | e. Who develops the curriculum, and how often is it updated? | Haris | LE curriculum is centrally developed by our Academic Team under the leadership of an Academic Director with more than 15 years of experience in education and curriculum development. The team includes curriculum specialists with international academic expertise, including graduates from Columbia University specializing in curriculum design. The curriculum is reviewed and refreshed every academic term to ensure continuous improvement, relevance, and alignment with evolving learner needs and educational best practices. | |||
208 | f. Does Living English own the curriculum and learning materials, or are they dependent on third-party content? | Haris | Living English owns and develops its core curriculum, pedagogical framework, and project-based learning methodology in-house. While we selectively utilize internationally recognized resources, such as Cambridge-aligned materials, these serve as complementary content rather than the foundation of the program. As a result, management maintains full control over curriculum development, learning outcomes, and future product innovation. | |||
209 | g. What is the process for handling parent complaints, teacher underperformance, and student dissatisfaction? | Haris | Living English maintains a structured customer experience and quality assurance process. Parent concerns are managed through our Customer Experience teams, while teacher performance is monitored through classroom observations, feedback mechanisms, and performance reviews. Student engagement and satisfaction are tracked continuously, enabling early interventions and personalized support where needed. Management treats customer feedback as a key driver of continuous improvement. | |||